library(ggplot2)
meins <- read.table("preisindex.csv", fileEncoding="UTF-8", header = TRUE, sep=";")
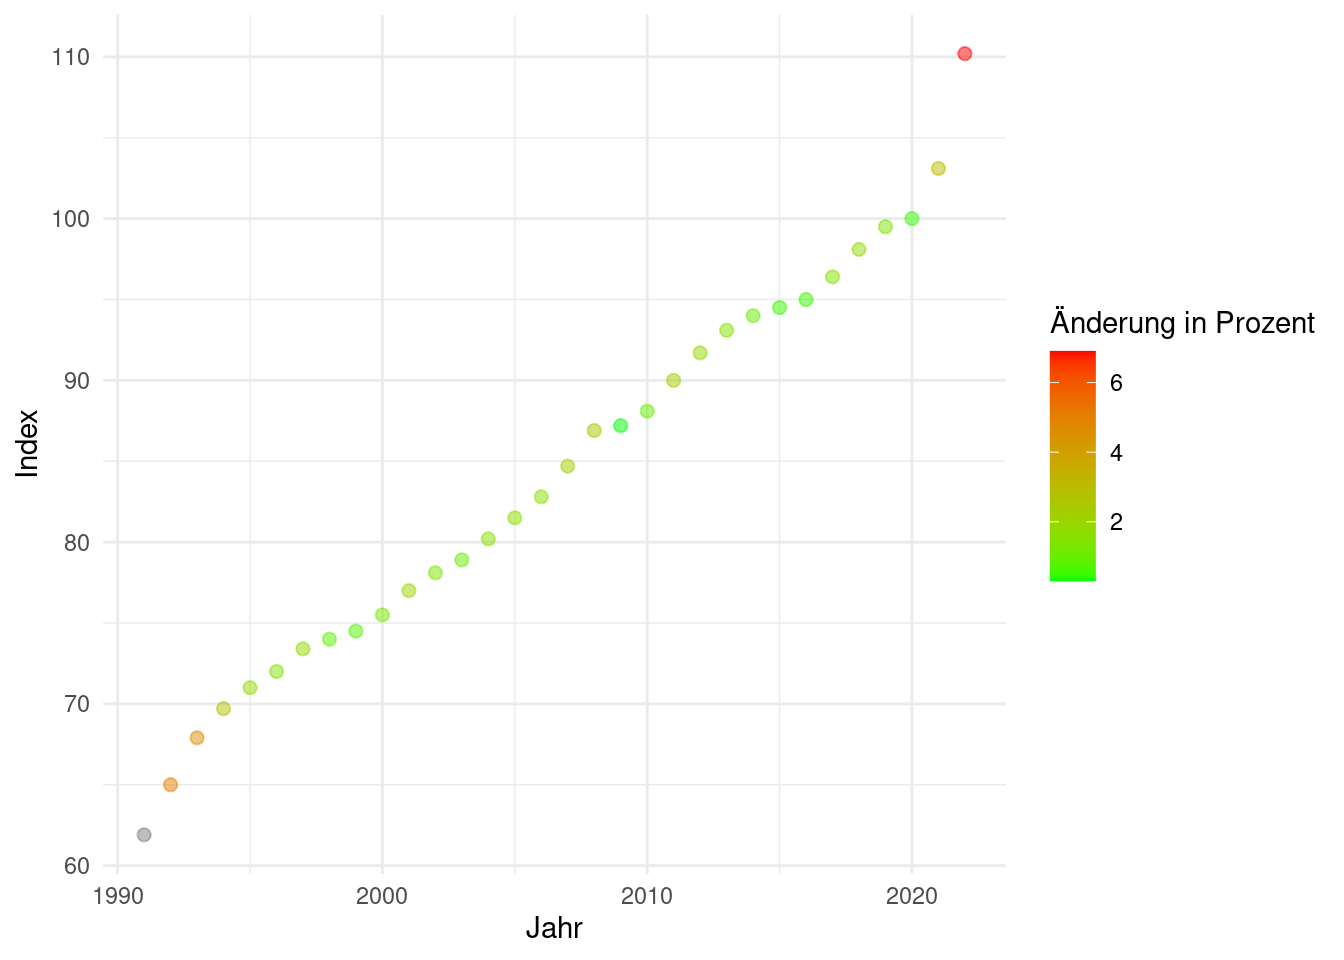
ggplot(meins, aes(x = Jahr, y = Index, color = Prozent )) +
geom_point(alpha = 0.5, size = 2) +
scale_color_gradient(low="green", high="red") +
theme_minimal() + labs(color="Änderung in Prozent")